Alerts
Overview
An alert is a notification about a potential security problem. SecuReporter offers several ways for you to monitor the security environment of your network. One way is by generating alerts when it detects potential security problems. Using user behavior analytics, SecuReporter is able to identify anomalous and suspicious activity, creating alerts to bring them to your attention.
Trend & Details
To see the alerts that have been raised by SecuReporter, click History > Alert.
On the screen, a graph sorts your recent alerts by the severity of the threat they pose to the network. The alert classifications are as follows:
• High severity – Events that are exceptionally harmful, such as attacks by viruses.
• Medium severity – Events that could collect users’ personal information or adversely affect the network.
• Low severity – Events that usually have no adverse effect on a network.
By default, trend lines for alerts of all three severity levels will appear in this graph. To hide the trend line of a severity level, click on its corresponding color block on the top.
Below the chart, you can view a complete log of all SecuReporter alerts that have been created. To order the alerts by variables such as Time, Category, Event Type, and Severity.
The following table shows event categories, types and criteria supported by SecuReporter at the time of writing.
Category | Event Types | Criteria | Time allowed |
|---|---|---|---|
Network Security | URL Threat Filter | Number of times connection attempts to or from a site in an URL threat category detected and blocked is greater than the threshold | 60 minutes |
Network Security | IP Reputation-Incoming | Number of times packets coming from an IPv4 address with bad reputation occurred is greater than the threshold | 10 minutes |
Network Security | IP Reputation-Outgoing | Number of times connection attempt to an IPv4 address with bad reputation occurred is greater than the threshold within | 60 minutes |
Network Security | Sandboxing malicious file | Number of malicious files destroyed is greater than the threshold | 5 minutes |
Network Security | Sandboxing suspicious file | Number of suspicious files destroyed is greater than the threshold | 5 minutes |
Network Security | DNS Filter | Number of times connection attempt to a FQDN that is blocked or in the threat category | 60 minutes |
Network Security | Attack counts | Number of highest severity attacks greater than the threshold | 5 minutes |
Network Security | Attack counts | Number of attacks greater than the threshold | 5 minutes |
Network Security | Malware/virus detection | Malware or virus attack count greater than the threshold | 5 minutes |
Network Security | Malware/virus detection | Number of times the same malware/virus is detected greater than the threshold | 15 minutes |
Network Security | Alert counts | Number of alerts greater than the threshold | 1 minute |
Device | Online status | Device offline for more than {threshold} minutes | 15 minutes |
Device | Reboot | Reboot | – |
Device | Concurrent sessions | Session numbers greater than the {threshold} % | – |
Anomaly | Login failure | Number of login failures over threshold | 1 minute |
Anomaly | Traffic anomaly | Number of scans/floods detected greater than the threshold | 5 minutes |
Anomaly | Protocol anomaly | Number of TCP/UDP/ICMP/IP decoders greater than the threshold | 5 minutes |
History > Alert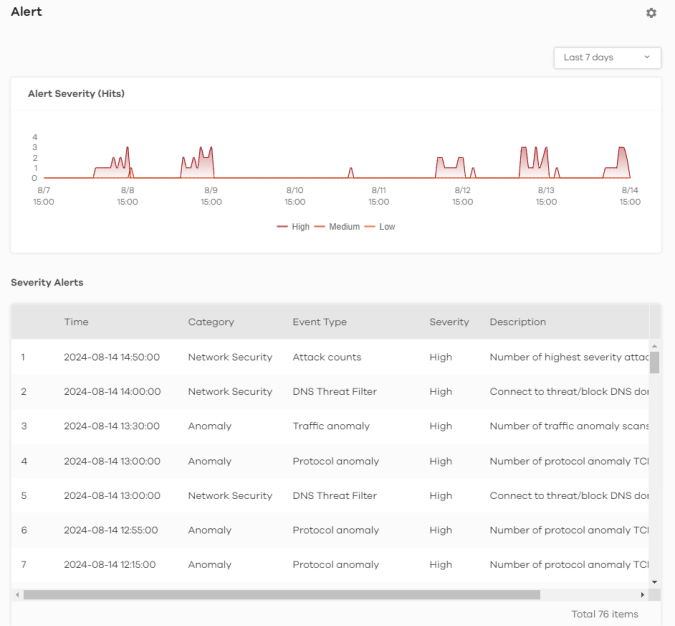
The following table describes the labels on this screen.
Label | DESCRIPTION |
|---|---|
Alert Severity (Hits) | Use this interactive graph to view trends in the severity of all the alerts that have been triggered on the network. The event severity classifications are as follows: High severity – Events that are exceptionally harmful, such as attacks by viruses [OR: 10 potential malware attacks within 5 minutes] Medium severity – Events that could collect users’ personal information or adversely affect the network [OR: 2 potential malware or virus attacks within 15 minutes] Low severity – Events that usually have no adverse effect on a network. Trend lines for all security classifications appear on the graph by default. Click on a color block to hide its corresponding trend line. |
Severity Alerts | This table shows a list of recent security events. |
Time | This displays the year-month-date hour:minute:second that the threat occurred. |
Category | This displays the alerts by category. |
Event type | This displays the type of alert that was triggered. Examples of alert types are IPS, Spam, Virus and Web. |
Severity | This displays the severity level as outlined in Threat History. |
Description | This displays the further information on this alert. |