Analysis Overview
Click Analysis > Security Indicator to show data visualizations related to the network’s security, management and what was blocked. The following screen will be displayed.
Data is displayed in the Analysis menus as follows.
Analysis > Security Indicator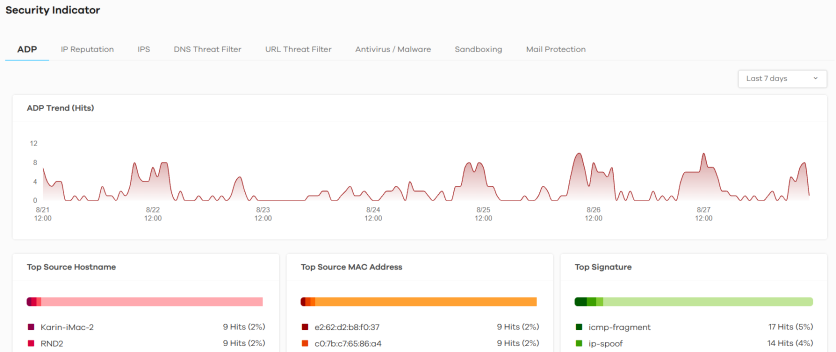
Security Indicators
Security Indicators data visualizations are categorized as:
• ADP
• IPS
ADP
Anomaly Detection and Prevention (ADP) protects against anomalies based on violations of protocol standards (RFCs – Requests for Comments) and abnormal flows such as port scans. This section introduces ADP, anomaly profiles and applying an ADP profile to a traffic direction.
Traffic Anomalies
Traffic anomaly policies look for abnormal behavior or events such as port scanning, sweeping or network flooding. They operate at OSI layer-2 and layer-3. Traffic anomaly policies may be updated when you upload new firmware.
Protocol Anomalies
Protocol anomalies are packets that do not comply with the relevant RFC (Request For Comments). Protocol anomaly detection includes:
• TCP Decoder
• UDP Decoder
• ICMP Decoder
Protocol anomaly policies may be updated when you upload new firmware.
The following figure shows the Analysis > Security Indicator > ADP data visualizations.
Analysis > Security Indicator > ADP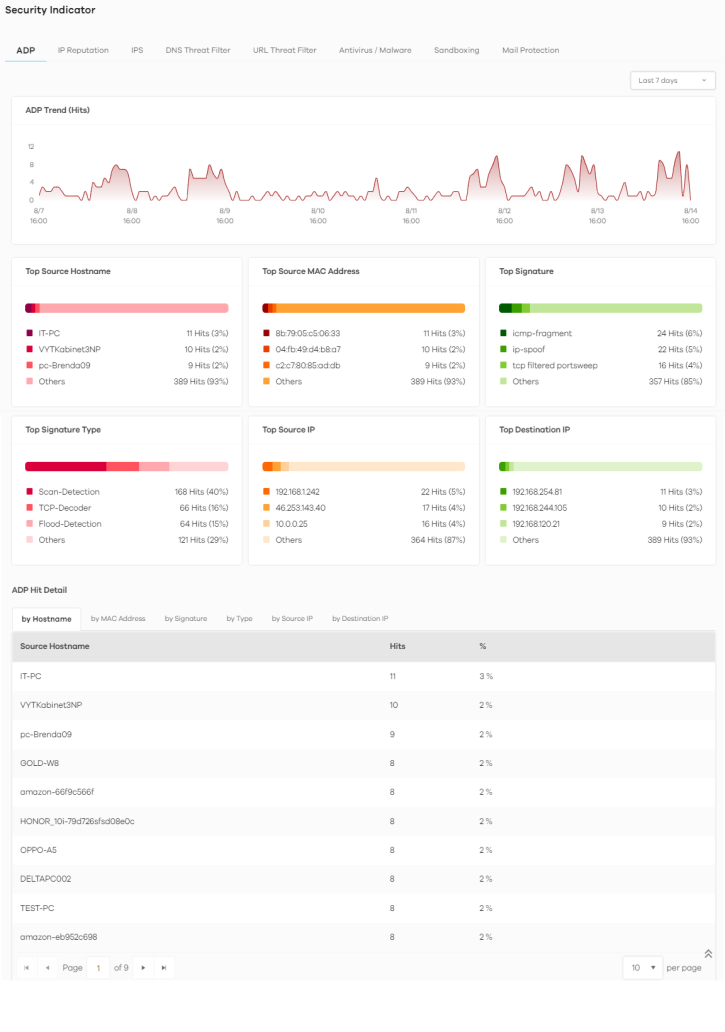
The following table describes the labels on the Analysis > Security Indicator > ADP screen.
Label | DESCRIPTION |
|---|---|
ADP Trend (Hits) | This chart displays patterns in anomalies detected by the Zyxel Device. Anomalies are based on violations of protocol standards (RFCs – Requests for Comments) or abnormal flows such as port scans. Move your cursor over a trend line to display the number of threats encountered over time. An anomaly hit is an anomaly detected by the Zyxel Device. |
Top Source Hostname | This chart displays the names of three devices that mostly send traffic to anomalous connections. Scroll down to ADP Hit Detail and click the by Hostname tab to display details about the anomalies that were detected. |
Top Source MAC Address | This chart displays the MAC addresses of the three devices that mostly send traffic to anomalous connections. Scroll down to ADP Hit Detail and click the by MAC Address tab to display details about the anomalies that were detected. |
Top Signature | This chart displays the three most common anomalies detected by the Zyxel Device. Scroll down to ADP Hit Detail and click the by Signature tab to display details about the anomalies that were detected. |
Top Signature Type | This chart displays the three most common anomaly types detected by the Zyxel Device. Scroll down to ADP Hit Detail and click the by Type tab to display details about the anomalies that were detected. |
Top Source IP | This chart displays the IP addresses of the three devices that mostly send traffic to anomalous connections. Scroll down to ADP Hit Detail and click the by Source IP tab to display details about the anomalies that were detected. |
Top Destination IP | This chart displays the IP addresses of the three devices that mostly receive traffic from anomalous connections. Scroll down to ADP Hit Detail and click the by Destination IP tab to display details about the anomalies that were detected. |
ADP Hit Detail | This displays the number of anomalies detected by the Zyxel Device, categorized by hostname, MAC address, signature, signature type, source IP address, and destination IP address. |
IP Reputation
When you register for and enable the IP reputation service, your Zyxel Device downloads signature files that identifies reputation of IPv4 addresses. You can have the Zyxel Device forward, block, and/or log packets from IPv4 addresses based on these signatures and categories.
The priority for IP Reputation checking is as below:
• White List
• Black List
• External Black List
• Local Zyxel Device Signatures
The following figure shows the Analysis > Security Indicator > IP Reputation data visualizations.
Analysis > Security Indicator > IP Reputation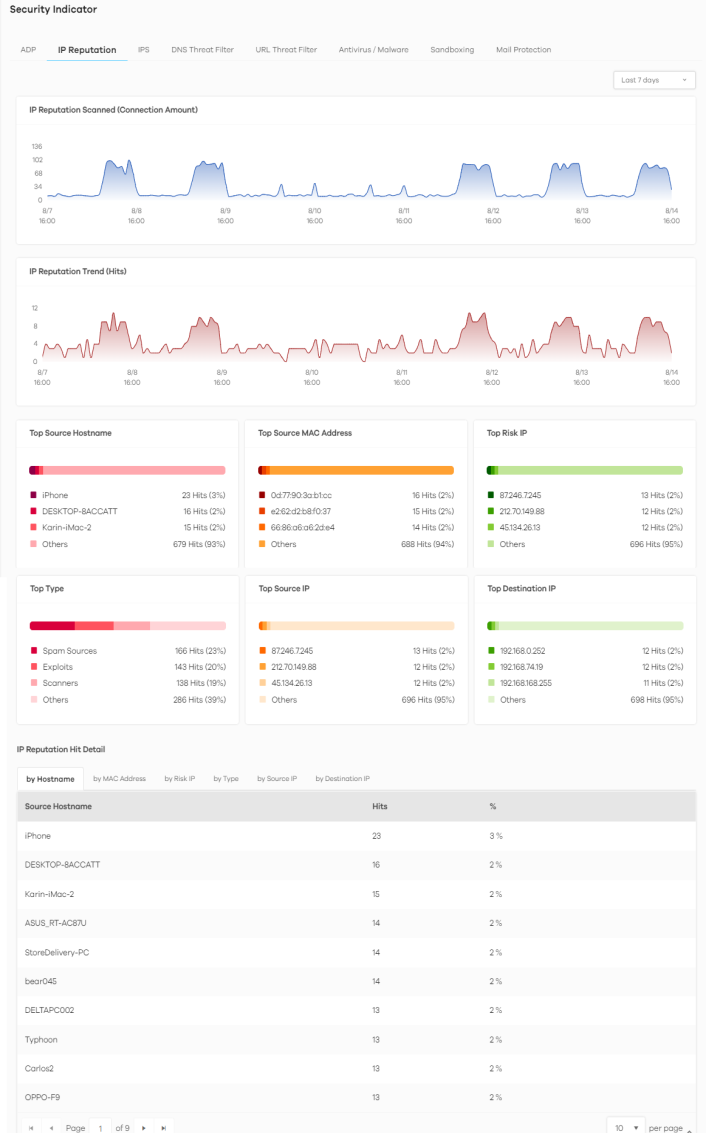
The following table describes the labels on the Analysis > Security Indicator > IP Reputation screen.
Label | DESCRIPTION |
|---|---|
IP Reputation Scanned (Connection Amount) | This chart displays the total number of connections detected by the Zyxel Device. Move your cursor over a trend line to display the number of connections encountered over time. |
IP Reputation Trend (Hits) | This chart displays the number of IP reputation threats detected by the Zyxel Device. Move your cursor over a trend line to display the number of threats encountered over time. |
Top Source Hostname | This chart displays the hostnames of the three devices that mostly send traffic to connections with IP addresses of poor reputation. Scroll down to IP Reputation Hit Detail and click the by Hostname tab to display details about the source hostnames that were detected. |
Top Source MAC Address | This chart displays the MAC addresses of the three devices that mostly send traffic to connections with IP addresses of poor reputation. Scroll down to IP Reputation Hit Detail and click the by MAC Address tab to display details about the source MAC addresses that were detected. |
Top Risk IP | This chart displays the IP addresses of the three devices that caused the most IP reputation threats. Scroll down to IP Reputation Hit Detail and click the by Risk IP tab to display details about the IP addresses that were detected by IP Reputation. Click an IP address to display the details. |
Top Type | This chart displays the three most common threats posed by IPs detected by the Zyxel Device as detected by IP Reputation. Threat categories include Negative Reputation, TOR Proxies, Denial of Service, Scanners, Web Attacks, Exploits, Spam Sources, Anonymous Proxies, Phishing, and Botnets. Scroll down to IP Reputation Hit Detail and click the by Type tab to display details about the threats posed by IPs detected by the Zyxel Device as detected by IP Reputation. |
Top Source IP | This chart displays the IP addresses of the three devices that mostly send traffic to connections with IP addresses of poor reputation. Scroll down to IP Reputation Hit Detail and click the by Source IP tab to display details about the source IP addresses that were detected. |
Top Destination IP | This chart displays the IP addresses of the three devices that mostly receive traffic from connections with IP addresses of poor reputation. Scroll down to IP Reputation Hit Detail and click the by Destination IP tab to display details about the destination IP addresses that were detected. |
IP Reputation Hit Detail | This displays the number of IP reputation threats detected by the Zyxel Device, categorized by hostname, MAC address, risk IP address, threat type, source IP address, and destination IP address. See Add or Remove a Risk IP Address to the Allow List for more information on how to add or remove a risk IP address from the allow list. |
Add or Remove a Risk IP Address to the Allow List
There is a blue check mark  next to the risk IP addresses that are in the allow list.
next to the risk IP addresses that are in the allow list.Do the following to add a risk IP address to the allow list:
1 Go to the Analysis > Security Indicator > IP Reputation screen and scroll down to IP Reputation Hit Detail and click the by Risk IP tab. Click the  button next to the risk IP address.
button next to the risk IP address. 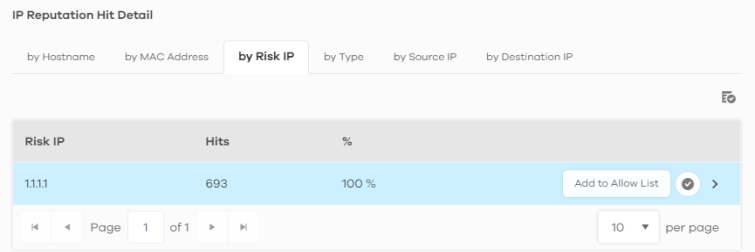
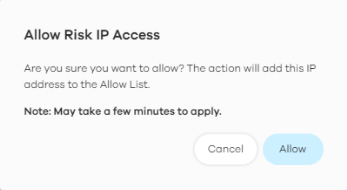
2 The following window pops up, click Allow to add the risk IP address to the allow list.
Do the following to remove a risk IP address from the allow list:
1 Go to the Analysis > Security Indicator > IP Reputation screen and scroll down to IP Reputation Hit Detail and click the by Risk IP tab. Click the  button next to the risk IP address.
button next to the risk IP address. 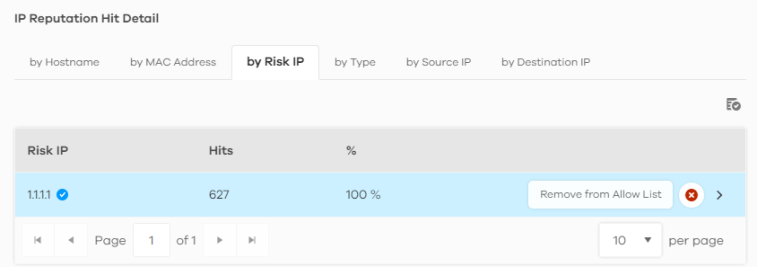
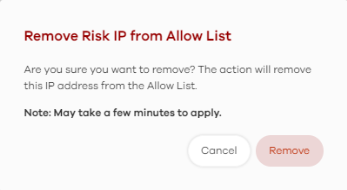
2 The following window pops up, click Remove to remove the IP address from the allow list.
IPS
An IPS profile is a set of packet inspection signatures.
A signature is a pattern of malicious or suspicious packet activity. You can specify an action to be taken if the system matches a stream of data to a malicious signature. You can change the action in the profile screens. Packet inspection examine OSI (Open System Interconnection) layer-4 to layer-7 packet contents for malicious data. Generally, packet inspection signatures are created for known attacks while anomaly detection looks for abnormal behavior.
Changes to the Zyxel Device’s IPS settings affect new sessions, but not the sessions that already exists before you apply the new settings.
The following figure shows the Analysis > Security Indicator > IPS data visualizations.
Analysis > Security Indicator > IPS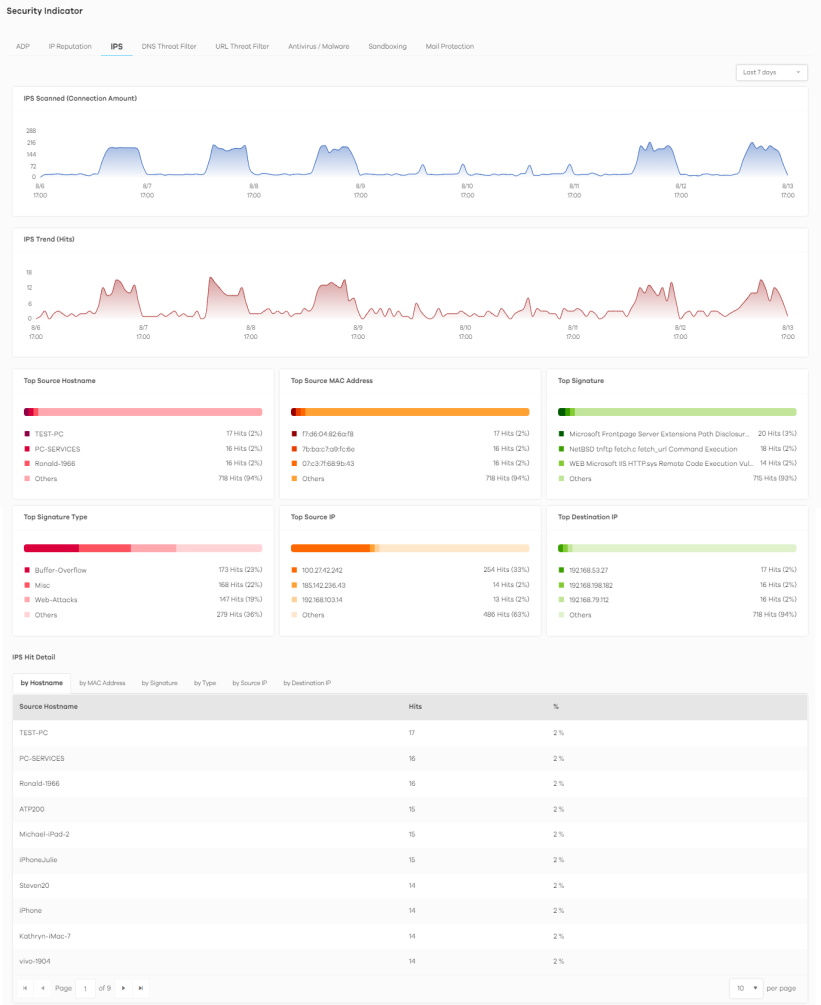
The following table describes the labels on the Analysis > Security Indicator > IPS screen.
Label | DESCRIPTION |
|---|---|
IPS Scanned (Connection Amount) | This chart displays the total number of connections detected by the Zyxel Device. Move your cursor over a trend line to display the number of connections encountered over time. |
IPS Trend (Hits) | This chart displays the number of malicious or suspicious packets detected by IPS in the Zyxel Devices. IPS (Intrusion Prevention System) uses signatures to detect malicious or suspicious packets to protect against network-based intrusions. Move your cursor over a trend line to display the number of threats encountered over time. |
Top Source Hostname | This chart displays the hostnames of the three devices that mostly send traffic to malicious or suspicious connections. Scroll down to IP Reputation Hit Detail and click the by Hostname tab to display details about the source host names that were detected. |
Top Source MAC Address | This chart displays the MAC addresses of the three devices that mostly send traffic to malicious or suspicious connections. Scroll down to IP Reputation Hit Detail and click the by MAC Address tab to display details about the source MAC addresses that were detected. |
Top Signature | This chart displays the top three malicious or suspicious packets detected by IPS in the Zyxel Devices. Scroll down to IPS Hit Detail and click the by Signature tab to display details about the intrusions that were detected. |
Top Signature Type | This chart displays the top three malicious or suspicious packet types detected by IPS in the Zyxel Devices. Scroll down to IPS Hit Detail and click the by Type tab to display details about the intrusions that were detected. |
Top Source IP | This chart displays the source IP addresses of the top three incoming malicious or suspicious packets detected by IPS in the Zyxel Devices. Scroll down to IPS Hit Detail and click the by Source IP tab to display details about the source IP addresses of the incoming malicious or suspicious packets. |
Top Destination IP | This chart displays the destination IP addresses of the top three incoming malicious or suspicious packets detected by IPS in the Zyxel Devices. Scroll down to IPS Hit Detail and click the by Destination IP tab to display details about the destination IP addresses of the incoming malicious or suspicious packets. |
IPS Hit Detail | This displays the number of malicious or suspicious packets detected by the Zyxel Device, categorized by hostname, MAC address, signature, signature type, source IP address, and destination IP address. |
Threat Intelligence
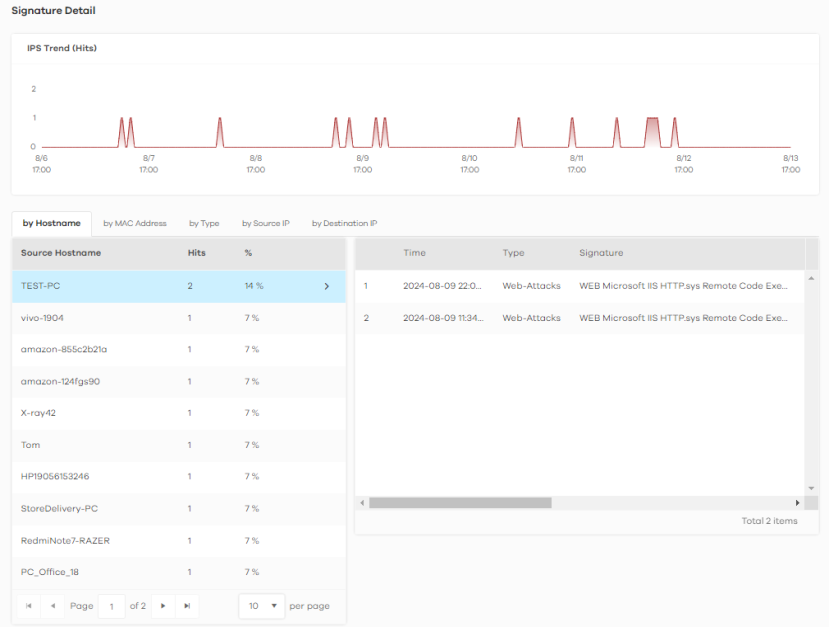
Click any item in the by Signature table to view the malicious or suspicious packets detected by IPS in detail.
Top Signature Details