DNS Threat Filter
A Domain Name System (DNS) server records mappings of FQDN (Fully Qualified Domain Names) to IP addresses. A FQDN consists of a host and domain name. For example, www.zyxel.com is a fully qualified domain name, where “www” is the host, “zyxel” is the second-level domain, and “com” is the top level domain.
DNS filtering inspects DNS queries made by clients on your network and compares the queries against a database of blocked or allowed FQDNs.
If a user attempts to connect to a suspect site, where the DNS query packet contains an FQDN with a bad reputation, then a DSN query is sent from the user’s computer and detected by the DNS Filter.
The Zyxel Device DNS threat filter will either drop the DNS query or reply to the user with a fake DNS response using the default dnsft.cloud.zyxel.com URL (where the user will see a “Web Page Blocked!” page) or a custom IP address.
The following type of DNS queries is allowed by the Zyxel Device:
• Type “A” for IPv4 addresses
The Zyxel Device replies with a DNS server error for the following types of DNS queries:
• Enter “AAAA” for IPv6 addresses
• Enter “NS” (Name Server) to get information about the authoritative name server
• Enter “MX” (Mail eXchange) to request information about the mail exchange server for a specific DNS domain name
• Enter “CNAME” (Canonical Names) that specifies a domain name that has to be queried in order to resolve the original DNS query
• Enter “PTR” (Pointer) that specifies a reverse query (requesting the FQDN corresponding to the IP address you provided
• Enter “SOA” (Start Of zone Authority) used when transferring zones
Click Analysis > Security Indicator > DNS Threat Filter to display the configuration screen as shown next.
Analysis > Security Indicator > DNS Threat Filter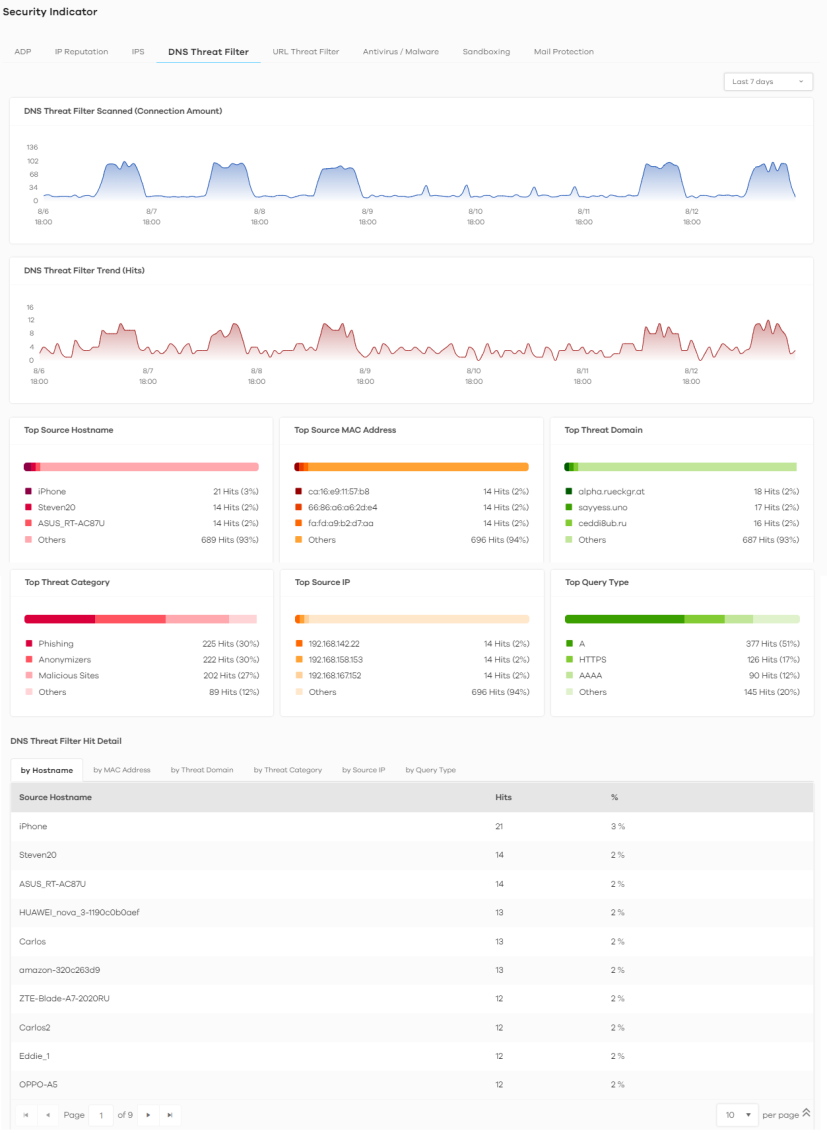
The following table describes the labels on the Analysis > Security Indicator > DNS Threat Filter screen.
Label | DESCRIPTION |
|---|---|
DNS Threat Filter Scanned (Connection Amount) | This chart displays the total number of connections detected by the Zyxel Device. Move your cursor over a trend line to display the number of connections encountered over time. |
DNS Threat Filter Trend (Hits) | This chart displays the number of URLs of FQDNs that may pose a security threat to network devices that were scanned. Move your cursor over a trend line to display the number of URLs of FQDNs encountered over time. |
Top Source Hostname | This chart displays the three most common source hostnames of the incoming malicious or suspicious files. Scroll down to DNS Filter Hit Detail and click the by Hostname tab to display details about the source hostnames. |
Top Source MAC Address | This chart displays the three most common source MAC addresses of the incoming malicious or suspicious files. Scroll down to DNS Filter Hit Detail and click the by MAC Address tab to display details about the source MAC addresses. |
Top Threat Domain | This chart displays the three most common URLs of FQDNs that may pose a security threat to network devices behind the Zyxel Device. Scroll down to DNS Filter Hit Detail and click the by DNS Filter Domain tab to display details about the URLs of FQDNs. |
Top Threat Category | This chart displays the three most common categories of FQDNs that may pose a security threat to network devices behind the Zyxel Device. Scroll down to DNS Filter Hit Detail and click the by Threat Category tab to display details about the categories of FQDNs. |
Top Source IP | This chart displays the three most common source IP addresses of the incoming malicious and/or suspicious files. Scroll down to DNS Filter Hit Detail and click the by Source IP tab to display details about the source IP addresses. |
Top Query Type | This chart displays the three most common types of DNS record of the security threat to network devices behind the Zyxel Device. Scroll down to DNS Filter Hit Detail and click the by Query Type tab to display details about the DNS record type. |
DNS Threat Filter Hit Detail | This displays the number of malicious or suspicious packets detected by the Zyxel Device, categorized by hostname, MAC address, threat domain, threat category, source IP address, and destination IP address. See Add or Remove a Threat Domain to the Allow List for more information on how to add or remove a threat domain from the allow list. |
Add or Remove a Threat Domain to the Allow List
There is a blue check mark  next to the threat domains that are in the allow list.
next to the threat domains that are in the allow list.Do the following to add a threat domain to the allow list:
1 Go to the Analysis > Security Indicator > DNS Threat Filter screen and scroll down to DNS Threat Filter Hit Detail and click the by Threat Domain tab. Click the  button next to the threat domain.
button next to the threat domain. 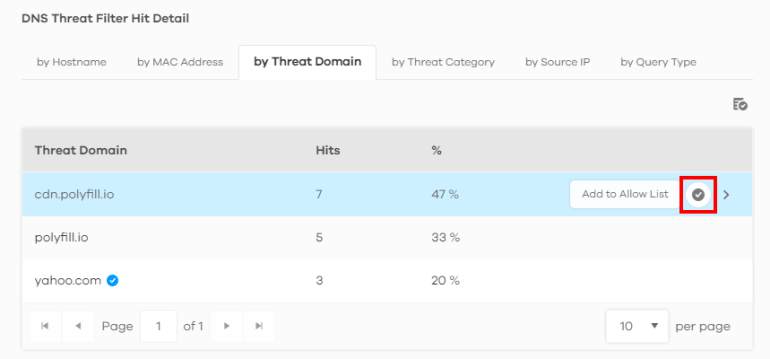
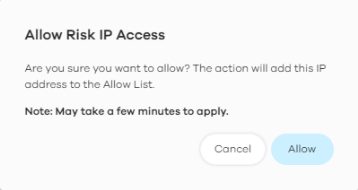
2 The following window pops up, click Allow to add the domain to the allow list.
Do the following to remove a threat domain from the allow list:
1 Go to the Analysis > Security Indicator > DNS Threat Filter screen and scroll down to DNS Threat Filter Hit Detail and click the by Threat Domain tab. Click the  button next to the threat domain.
button next to the threat domain. 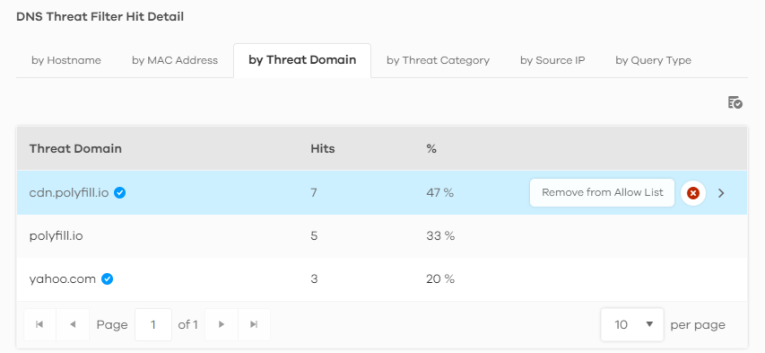
2 The following window pops up, click Remove to remove the threat domain from the allow list.
URL Threat Filter
When you enable the URL Threat filtering service, your Zyxel Device downloads signature files that contain known URL Threat domain names and IP addresses. The Zyxel Device will also access an external database that has millions of web sites categorized based on content. You can have the Zyxel Device allow, block, warn and/or log access to web sites or hosts based on these signatures and categories.
The priority for URL Threat checking is as below:
• White List
• Black List
• External Black List
• Local Zyxel Device Signatures
• Cloud Query Cache
• Cloud Query
The following figure shows the Analysis > Security Indicator > URL Threat Filter data visualizations.
Analysis > Security Indicator > URL Threat Filter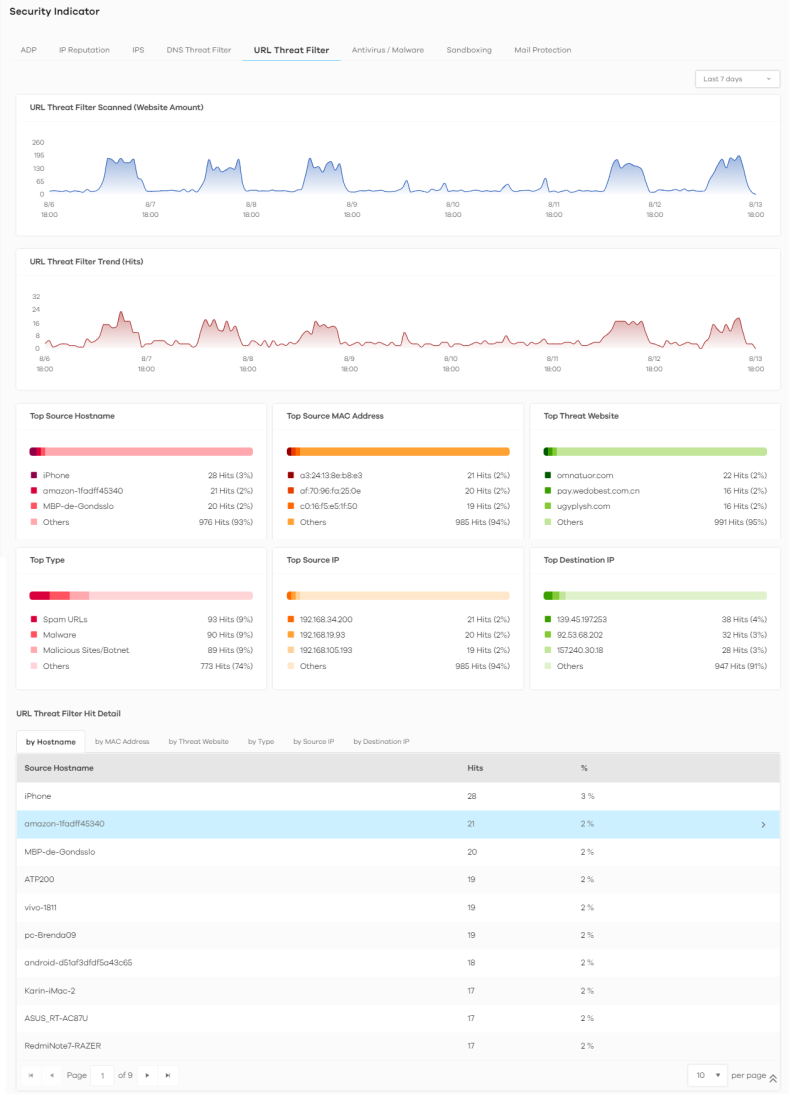
The following table describes the labels on the Analysis > Security Indicator > URL Threat Filter screen.
Label | DESCRIPTION |
|---|---|
URL Threat Filter Scanned (Website Amount) | This chart displays the total number of connections detected by the Zyxel Device. Move your cursor over a trend line to display the number of connections encountered over time. |
URL Threat Filter Trend (Hits) | This chart displays the number of threats posed by websites detected by the Zyxel Devices. Move your cursor over a trend line to display the number of threats encountered over time. |
Top Source Hostname | This chart displays the three most common source hostnames of the incoming malicious or suspicious files. Scroll down to DNS Filter Hit Detail and click the by Hostname tab to display details about the source hostnames. |
Top Source MAC Address | This chart displays the three most common source MAC addresses of the incoming malicious or suspicious files. Scroll down to DNS Filter Hit Detail and click the by MAC Address tab to display details about the source MAC addresses. |
Top Threat Website | This chart displays the top three threat websites detected by the Zyxel Device. Scroll down to URL Threat Filter Hit Detail and click the by Threat Website tab to display details about the specific websites that were detected. |
Top Type | This chart displays the top three most common types of threats posed by websites detected by the Zyxel Devices. Threat categories include Spam URL, Malicious Sites/Botnet, Black List, Anonymizers, Spyware Adware Keylogger, Browser Exploits, and Phishing. Scroll down to URL Threat Filter Hit Detail and click the by Type tab to display details about the threats posed by websites that were detected. |
Top Source IP | This chart displays the source IP addresses of the three most common incoming threat websites. Scroll down to URL Threat Filter Hit Detail and click the by Source IP tab to display details about the source IP addresses of the incoming threat websites that were detected. |
Top Destination IP | This chart displays the destination IP addresses of the three most common incoming threat websites. Scroll down to URL Threat Filter Hit Detail and click the by Destination IP tab to display details about the destination IP addresses of the incoming threat websites that were detected. |
URL Threat Filter Hit Detail | This displays the number of threat websites detected by the Zyxel Device, categorized by hostname, MAC address, threat website, threat type, source IP address, or destination IP address. See Add or Remove a Threat Website to the Allow List for more information on how to add or remove a domain from the allow list. |
Add or Remove a Threat Website to the Allow List
There is a blue check mark  next to the domain in the allow list.
next to the domain in the allow list.Do the following to add a domain to the allow list:
1 Go to the Analysis > Security Indicator > URL Threat Filter screen and scroll down to URL Threat Filter Hit Detail and click the by Threat URL tab. Click the  button next to the threat website.
button next to the threat website. 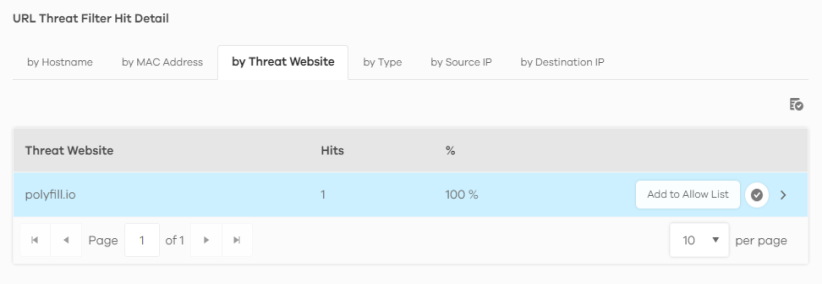
2 The following window pops up, click Allow to add the threat website to the allow list.
Do the following to remove a threat website from the allow list:
1 Go to the Analysis > Security Indicator > URL Threat Filter screen and scroll down to URL Threat Filter Hit Detail and click the by Threat Website tab. Click the  button next to the threat website.
button next to the threat website. 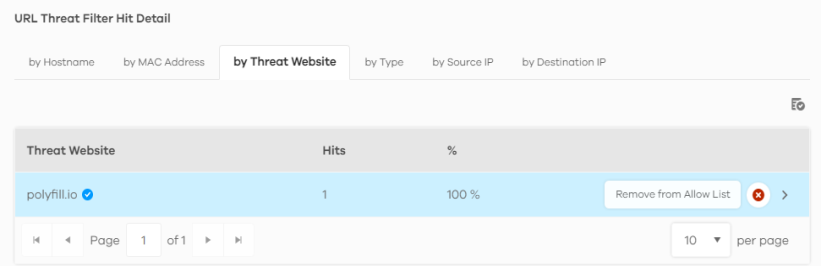
2 The following window pops up, click Remove to remove the threat website from the allow list.

Antivirus / Malware
Malware is short for malicious software, such as computer viruses, worms and spyware. The Zyxel Device antivirus / malware feature protects your connected network from malware by scanning traffic coming in from the WAN and going out from the WAN. The traffic scanned by the Zyxel Device may include FTP traffic and email with attachments.
The following figure shows the Analysis > Security Indicator > Antivirus / Malware data visualizations.
Analysis > Security Indicator > Antivirus / Malware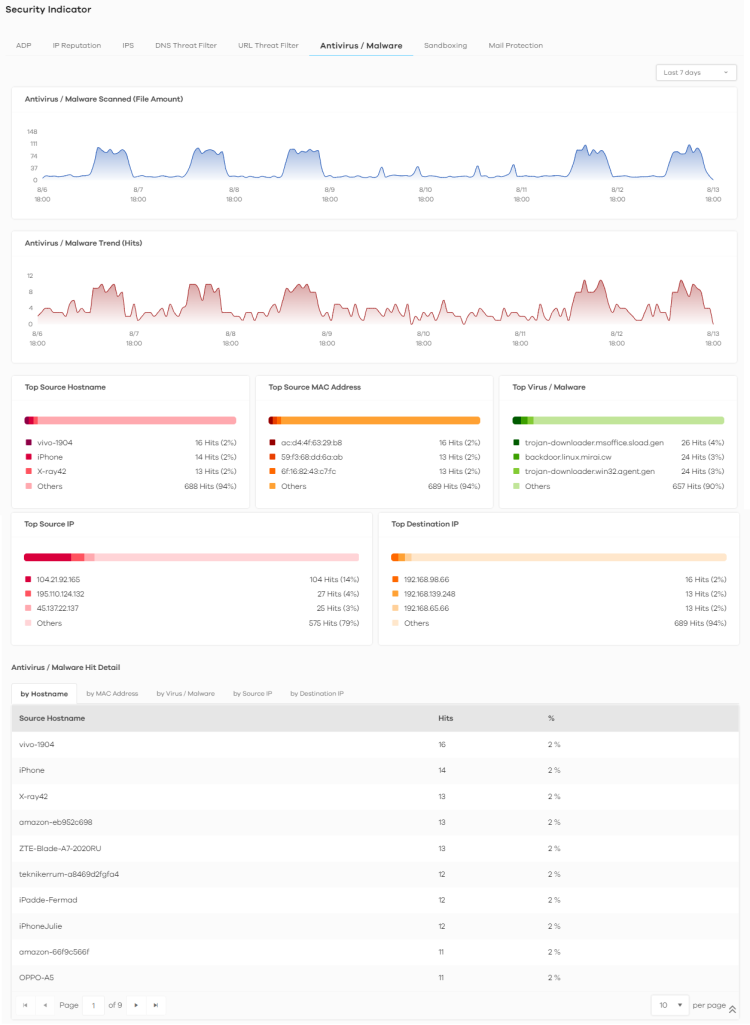
The following table describes the labels on the Analysis > Security Indicator > Antivirus / Malware screen.
Label | DESCRIPTION |
|---|---|
Antivirus / Malware Scanned (File Amount) | This chart displays the total number of connections detected by the Zyxel Device. Move your cursor over a trend line to display the number of connections encountered over time. |
Antivirus/Malware Trend (Hits) | This chart displays patterns in threats by the number of virus or malware attacks detected by the Zyxel Device. Move your cursor over a trend line to display the number of threats encountered over time. |
Top Source Hostname | This chart displays the three most common source hostnames of virus or malware attacks detected by the Zyxel Device. Scroll down to DNS Filter Hit Detail and click the by Hostname tab to display details about the source hostnames. |
Top Source MAC Address | This chart displays the three most common source MAC addresses of virus or malware attacks detected by the Zyxel Device. Scroll down to DNS Filter Hit Detail and click the by MAC Address tab to display details about the source MAC addresses. |
Top Virus / Malware | This chart displays the three most common malware and viruses detected by the Zyxel Device. Scroll down to Antivirus / Malware Hit Detail and click the by Virus / Malware tab to display details about the malware and viruses that were detected. |
Top Source IP | This chart displays the source IP addresses of the three most common malware and viruses detected by the Zyxel Device. Scroll down to Antivirus / Malware Hit Detail and click the by Source IP tab to display details about the source IP addresses of the incoming malicious and/or suspicious files. |
Top Destination IP | This chart displays the destination IP addresses of the three most common malware and viruses detected by the Zyxel Device. Scroll down to Antivirus / Malware Hit Detail and click the by Destination IP tab to display details about the destination IP addresses of the incoming malicious and/or suspicious files. |
Antivirus / Malware Hit Detail | This displays the number of antivirus and malware detected by the Zyxel Device categorized by hostname, MAC address, virus and malware, source IP address, or destination IP address. |
Sandboxing
This screen displays sandboxing statistics. See Sandboxing for more information about sandboxing.
Sandboxing statistics will automatically be removed from the list after one month.
The following figure shows the Analysis > Security Indicator > Sandboxing data visualizations.
Analysis > Security Indicator > Sandboxing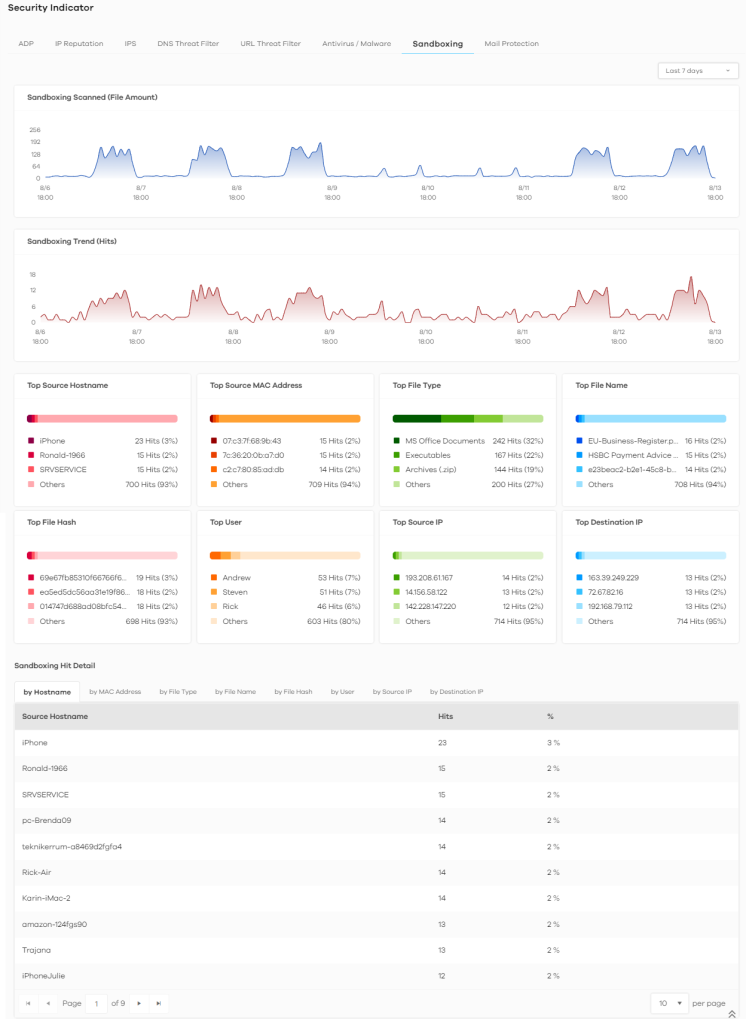
The following table describes the labels on the Analysis > Security Indicator > Sandboxing screen.
Label | DESCRIPTION |
|---|---|
Sandboxing Scanned (File Amount) | This chart displays the total number of connections detected by the Zyxel Device. Move your cursor over a trend line to display the number of connections encountered over time. |
Sandboxing Trend (Hits) | This chart displays the number of malicious and/or suspicious files that were scanned. Move your cursor over a trend line to display the number of malicious and/or suspicious files encountered over time. |
Top File Type | This chart displays the three most common types of malicious and/or suspicious files. Scroll down to Sandboxing Hit Detail and click the by File Type tab to display details about the malicious and/or suspicious file types. |
Top File Name | This chart displays the file names of the three most common incoming malicious and/or suspicious files. Scroll down to Sandboxing Hit Detail and click the by File Name tab to display details about the file names of the incoming malicious and/or suspicious files. |
Top File Hash | This chart displays the hash values of the three most common incoming malicious and/or suspicious files. Scroll down to Sandboxing Hit Detail and click the by File Hash tab to display details about the hash values of the incoming malicious and/or suspicious files. |
Top User | This chart displays the three users who receive malicious and/or suspicious files the most. Scroll down to Sandboxing Hit Detail and click the by User tab to display details about the users that are at risk of malicious and/or suspicious files. |
Top Source IP | This chart displays the source IP addresses of the three most common incoming malicious and/or suspicious files. Scroll down to Sandboxing Hit Detail and click the by Source IP tab to display details about the source IP addresses of incoming malicious and/or suspicious files. |
Top Destination IP | This chart displays the three destination IP addresses that receive the most incoming malicious and/or suspicious files. Scroll down to Sandboxing Hit Detail and click the by Destination IP tab to display details about the destination IP addresses of incoming malicious and/or suspicious files. |
Sandboxing Hit Detail | This displays the number of malicious and/or suspicious files detected by the Zyxel Device, categorized by hostname, MAC address, file type, file name, file hash, user, source IP address, or destination IP address. |
Mail Protection
Mail protection mark or discard spam (unsolicited commercial or junk email). This screen shows you the information of spam mails detected by the Zyxel Device.
The following figure shows the Analysis > Security Indicator > Mail Protection data visualizations.
Analysis > Security Indicator > Mail Protection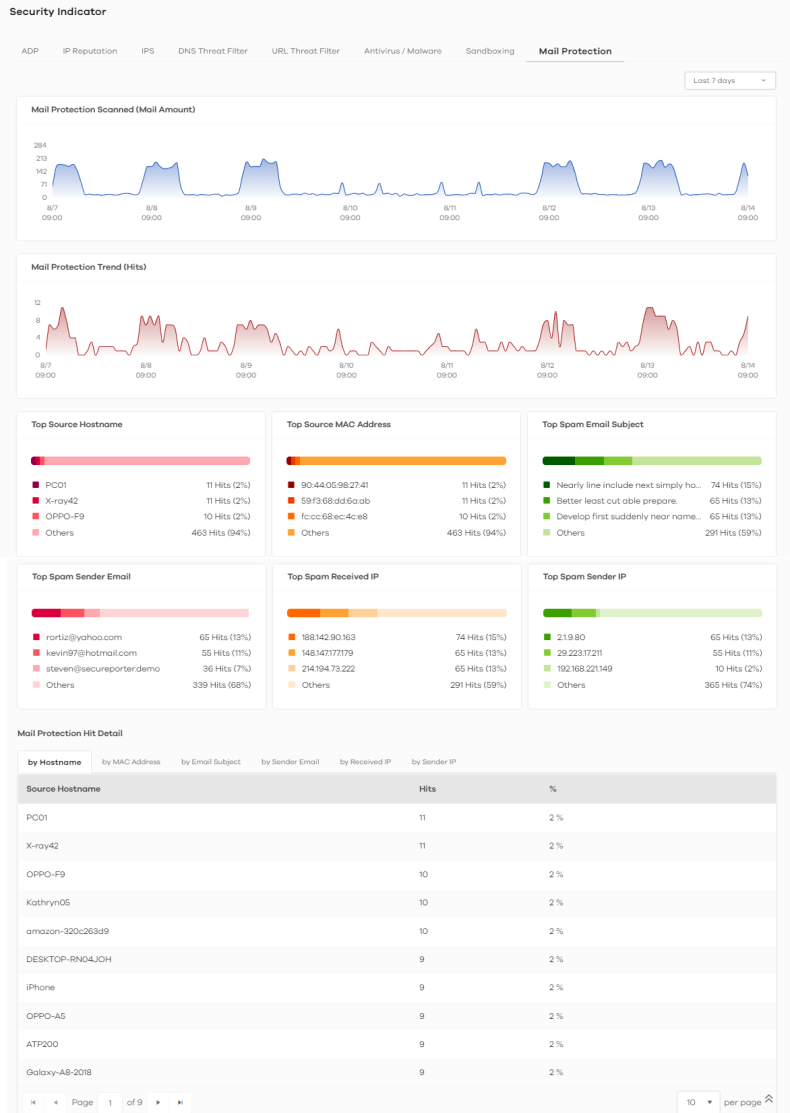
The following table describes the labels on the Analysis > Security Indicator > Mail Protection screen.
Label | DESCRIPTION |
|---|---|
Mail Protection Scanned (Mail Amount) | This chart displays the total number of mails detected by the Zyxel Device. Move your cursor over a trend line to display the number of mails sent and received over time. |
Mail Protection Trend (Hits) | This chart displays the number of spam mails detected by the Zyxel Device. Move your cursor over a trend line to display the number of threats encountered over time. |
Top Source Hostname | This chart displays the three most common spam email sender hostnames detected by the Zyxel Device. Scroll down to Email Spam Hit Detail and click the by Hostname tab to display details about the spam email sender hostnames that were detected. |
Top Source MAC Address | This chart displays the three most common spam email sender MAC addresses detected by the Zyxel Device. Scroll down to Email Spam Hit Detail and click the by MAC Address tab to display details about the spam email sender MAC addresses that were detected. |
Top Spam Email Subject | This chart displays the three most common spam email subjects detected by the Zyxel Device. Scroll down to Email Spam Hit Detail and click the by Email Subject tab to display details about the spam email subjects that were detected. |
Top Spam Sender Email | This chart displays the three most common spam email senders detected by the Zyxel Device. Scroll down to Email Spam Hit Detail and click the by Sender Email tab to display details about the spam email senders that were detected. |
Top Spam Received IP | This chart displays the three most common traffic classified as spam received by the internal users of the Zyxel Device. Scroll down to Email Spam Hit Detail and click the by Received IP tab to display details about the spam email recipients that were detected. |
Top Spam Sender IP | This chart displays the three most common traffic classified as spam sent from the internal users of the Zyxel Device. Scroll down to Email Spam Hit Detail and click the by Sender IP tab to display details about the spam traffic source that were detected. |
Mail Protection Hit Detail | This displays the information of spam mails detected by the Zyxel Device, categorized by hostname, MAC address, email subject, sender email, sender IP address, or received IP address. |
Network Activity
Network Activity data visualizations are categorized as:
DNS Content Filter
DNS (Domain Name System) content filter blocks or allow access to websites based on domain names. The following figure shows the Analysis > Network Activity > DNS Content Filter data visualizations.
Analysis > Network Activity > DNS Content Filter 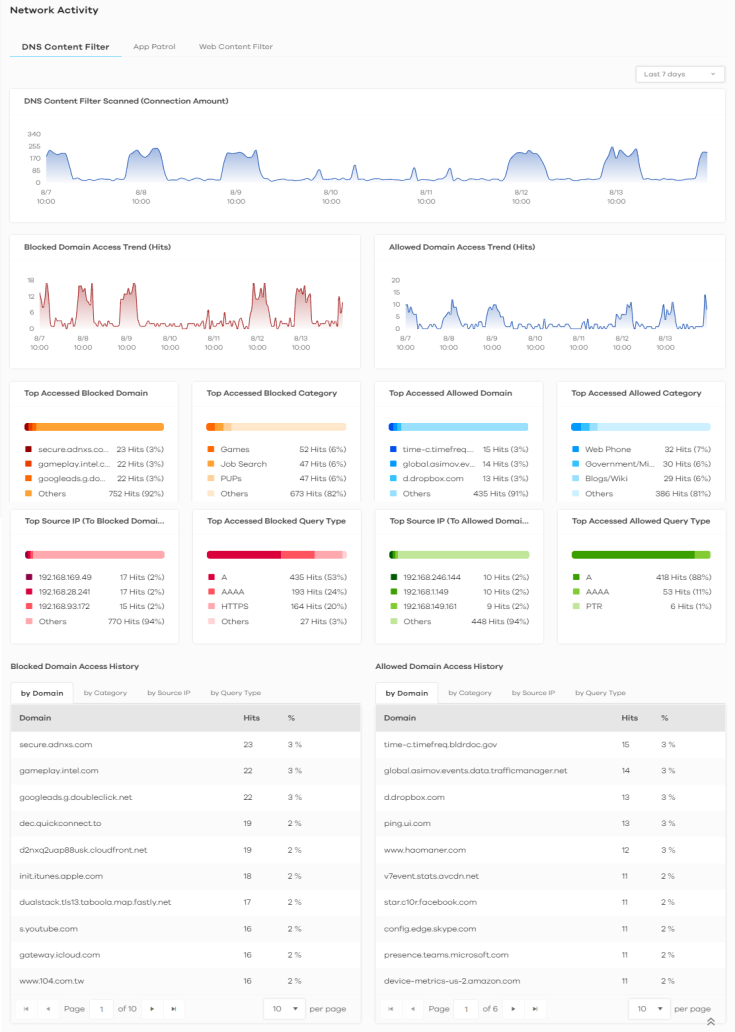
The following table describes the labels on the Analysis > Network Activity > DNS Content Filter screen.
Label | DESCRIPTION |
|---|---|
DNS Content Filter Scanned (Connection Amount) | This chart displays the total number of connections detected by the Zyxel Device. Move your cursor over a trend line to display the number of connections encountered over time. |
Blocked Domain Access Trend (Hits) | This chart displays the number of accesses to blocked domains that were scanned. Move your cursor over a trend line to display the number of accesses to blocked domains encountered over time. |
Allowed Domain Access Trend (Hits) | This chart displays the number of accesses to allowed domains that were scanned. Move your cursor over a trend line to display the number of accesses to allowed domains encountered over time. |
Top Accessed Blocked Domain | This chart displays the three most commonly accessed blocked domains. Scroll down to Blocked Domain Access History and click the by Domain tab to display details about the accesses to blocked domains that were scanned. |
Top Accessed Blocked Category | This chart displays the three most common categories of blocked domains accessed. Scroll down to Blocked Domain Access History and click the by Category tab to display details about the accesses to blocked domains that were scanned. |
Top Accessed Allowed Domain | This chart displays the three most commonly accessed allowed domains. Scroll down to Allowed Domain Access History and click the by Domain tab to display details about the accesses to allowed domains that were scanned. |
Top Accessed Allowed Category | This chart displays the three most common categories of allowed domains accessed. Scroll down to Allowed Domain Access History and click the by Category tab to display details about the accesses to allowed domains that were scanned. |
Top Source IP (To Blocked Domain) | This chart displays the source IP addresses of the three most commonly accessed blocked domains. Scroll down to Blocked Domain Access History and click the by Source IP tab to display details about the source IP addresses of the blocked domains. |
Top Accessed Blocked Query Type | This chart displays the three most common DNS record types for accessed domains that were blocked. Scroll down to Blocked Domain Access History and click the by Query Type tab to display details about the DNS record types of the blocked domains. |
Top Source IP (To Allowed Domain) | This chart displays the source IP addresses of the three most commonly accessed allowed domains. Scroll down to Allowed Domain Access History and click the by Source IP tab to display details about the source IP addresses of the allowed domains. |
Top Accessed Allowed Query Type | This chart displays the three most common DNS record types for accessed domains that were allowed. Scroll down to Allowed Domain Access History and click the by Query Type tab to display details about the DNS record types of the allowed domains. |
Blocked Domain Access History | This displays the domains that are blocked by the Zyxel Device, categorized by domain name, category, source IP address, and DNS record types. |
Allowed Domain Access History | This displays the domains that are allowed by the Zyxel Device, categorized by domain name, category, source IP address, and DNS record types. |
App Patrol
Application Patrol provides a convenient way to manage the use of various applications on the network. It manages general protocols (for example, HTTP and FTP) and instant messenger (IM), peer-to-peer (P2P), Voice over IP (VoIP), and streaming (RSTP) applications. You can even control the use of a particular application’s individual features (like text messaging, voice, video conferencing, and file transfers).
Application Patrol examines every TCP and UDP connection passing through the Zyxel Device and identifies what application is using the connection. Then, you can specify whether or not the Zyxel Device continues to route the connection. Traffic not recognized by the application patrol signatures is ignored.
The following figure shows the Analysis > Network Activity > App Patrol data visualizations.
Analysis > Network Activity > App Patrol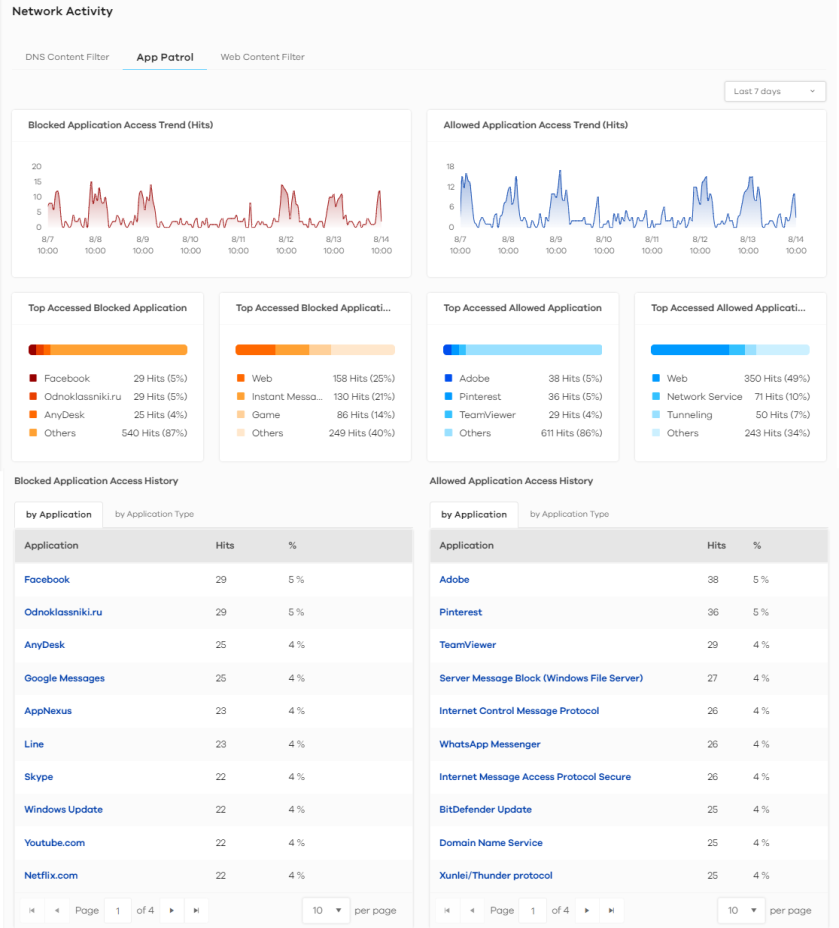
The following table describes the labels on the Analysis > Network Activity > App Patrol screen.
Label | DESCRIPTION |
|---|---|
Blocked Application Access Trend (Hits) | This chart displays the most commonly used applications accessed through the Zyxel Device as detected and blocked by Application Patrol. Move your cursor over a trend line to display the number of threats encountered over time. |
Allowed Application Access Trend (Hits) | This chart displays the number of most frequently visited applications through the Zyxel Device as detected by Application Patrol. Application Patrol manages general protocols (for example, HTTP and FTP, instant messenger (IM), peer-to-peer (P2P), Voice over IP (VoIP), streaming (RSTP) applications and even an application’s individual features (like text messaging, voice, video conferencing, and file transfers). Move your cursor over a trend line to display the number of threats encountered over time. |
Top Accessed Blocked Application | This chart displays the three applications that were blocked the most frequently by the Zyxel Device. Scroll down to Blocked Application Access History and click the Application Name tab to display details about the specific applications that were blocked. |
Top Accessed Blocked Application Type | This chart displays the three types of application that were blocked the most frequently by the Zyxel Device. Scroll down to Blocked Application Access History and click the Application Type tab to display details about the specific application types that were blocked. |
Top Access Allowed Application | This chart displays the three applications that were accessed the most frequently by the Zyxel Device. Scroll down to Allowed Application Access History and click the Application Name tab to display details about the specific applications that were accessed. |
Top Access Allowed Application Type | This chart displays the three applications that were accessed the most frequently by the Zyxel Device. Scroll down to Allowed Application Access History and click the Application Type tab to display details about the specific application types that were accessed. |
Blocked Application Access History | This displays the applications that are blocked by the Zyxel Device, categorized by application and application type. |
Allowed Application Access History | This displays the applications that are allowed by the Zyxel Device, categorized by application and application type. |
Web Content Filter
Web content filter restrict access to specific websites based on the policy you set on the Zyxel Device. The following figure shows the Analysis > Network Activity > Web Content Filter data visualizations.
Analysis > Network Activity > Web Content Filter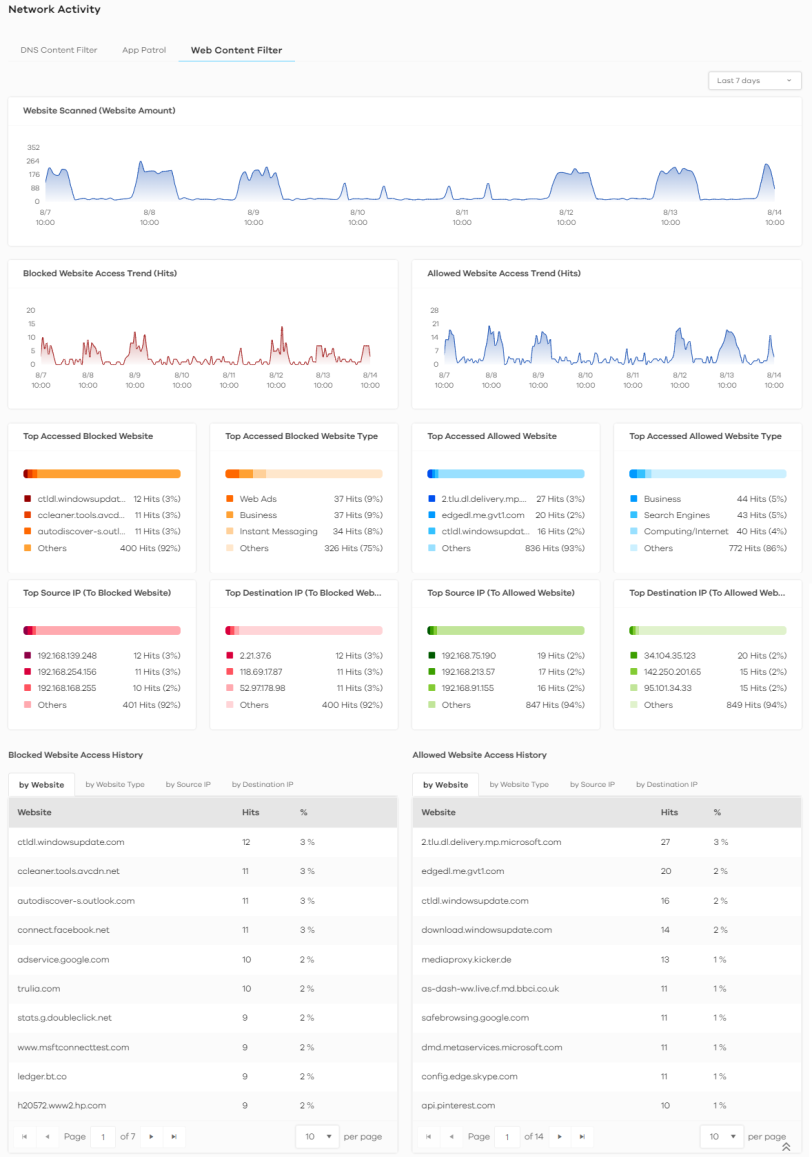
The following table describes the labels on the Analysis > Network Activity > Web Content Filter screen.
Label | DESCRIPTION |
|---|---|
Website Scanned (Website Amount) | This chart displays the total number of websites detected by the Zyxel Device. Move your cursor over a trend line to display the number of websites encountered over time. |
Blocked Website Access Trend (Hits) | This chart displays the number of accesses to blocked websites that were scanned. Move your cursor over a trend line to display the number of accesses to blocked websites encountered over time. |
Allowed Website Access Trend (Hits) | This chart displays the number of accesses to allowed websites that were scanned. Move your cursor over a trend line to display the number of accesses to allowed websites encountered over time. |
Top Accessed Blocked Website | This chart displays the three most commonly accessed blocked websites. Scroll down to Blocked Website Access History and click the by Website tab to display details about the accesses to blocked websites that were scanned. |
Top Accessed Blocked Website Type | This chart displays the three most common types of blocked websites accessed. Scroll down to Blocked Website Access History and click the by Website Type tab to display details about the types of blocked websites that were scanned. |
Top Accessed Allowed Website | This chart displays the three most commonly accessed allowed websites. Scroll down to Allowed Website Access History and click the by Website tab to display details about the accesses to blocked websites that were scanned. |
Top Accessed Allowed Website Type | This chart displays the three most common types of allowed websites accessed. Scroll down to Allowed Website Access History and click the by Website Type tab to display details about the types of allowed websites that were scanned. |
Top Source IP (To Blocked Website) | This chart displays the source IP addresses of the three most commonly accessed blocked websites. Scroll down to Allowed Website Access History and click the by Source IP tab to display details about the source IP addresses of the blocked websites. |
Top Destination IP (To Blocked Website) | This chart displays the destination IP addresses of the three most commonly accessed blocked websites. Scroll down to Blocked Website Access History and click the by Destination IP tab to display details about the destination IP addresses of the blocked websites. |
Top Source IP (To Allowed Website) | This chart displays the source IP addresses of the three most commonly accessed allowed websites. Scroll down to Allowed Website Access History and click the by Source IP tab to display details about the source IP addresses of the allowed websites. |
Top Destination IP (To Allowed Website) | This chart displays the destination IP addresses of the three most commonly accessed allowed websites. Scroll down to Allowed Website Access History and click the by Destination IP tab to display details about the destination IP addresses of the allowed websites. |
Blocked Website Access History | This displays the blocked websites accessed the most frequently as detected by the Zyxel Device, categorized by website, website type, source IP address, and destination IP address. |
Allowed Website Access History | This displays the allowed websites accessed the most frequently as detected by the Zyxel Device, categorized by website, website type, source IP address, and destination IP address. |
Traffic
Use this screen to view the details about the bandwidth usage on the network. The following figure shows the Analysis > Traffic data visualizations.
Analysis > Network Activity > Traffic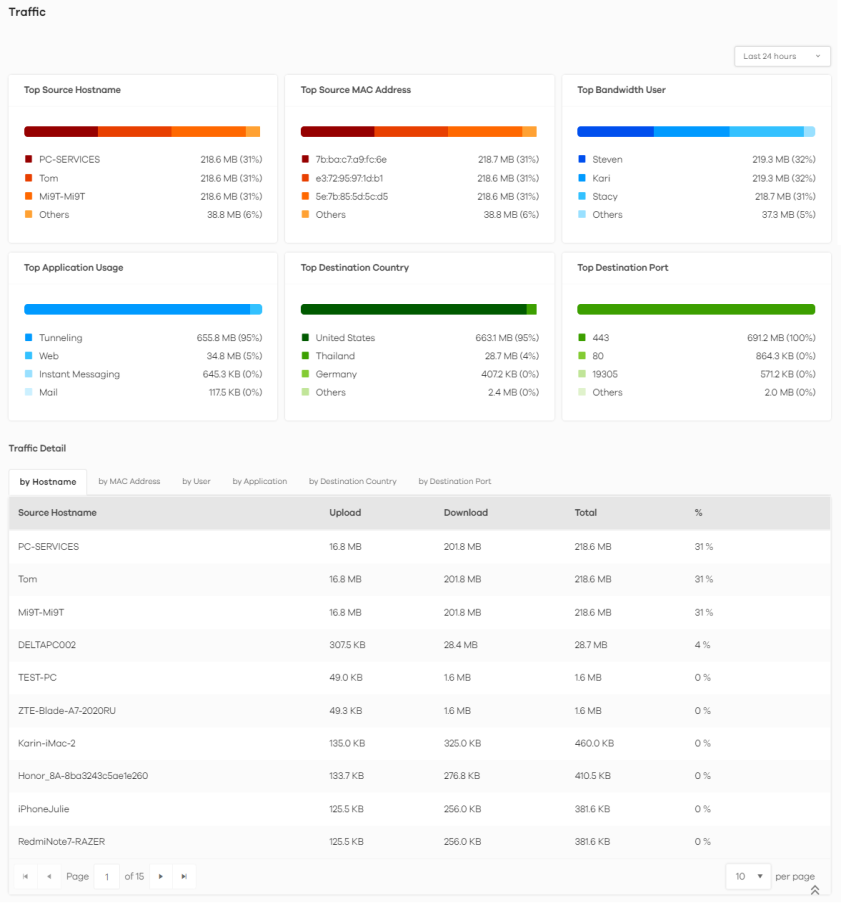
The following table describes the labels on the Analysis > Network Activity > Traffic screen.
Label | DESCRIPTION |
|---|---|
Top Source Hostname | This chart displays the three hostnames with the greatest bandwidth usage on the network. Scroll down to Traffic Detail and click the by Hostname tab to display details about the hostnames that send the most traffic. |
Top Source MAC Address | This chart displays the three MAC addresses with the greatest bandwidth usage on the network. Scroll down to Traffic Detail and click the by MAC Address tab to display details about the MAC addresses that send the most traffic. |
Top Bandwidth User | This displays the top three users of bandwidth on the network. Scroll down to Traffic Detail and click the by User tab to display details about the users that use the most bandwidth on the network. |
Top Application Usage | This displays the network applications with the greatest bandwidth usage on the network. Scroll down to Traffic Detail and click the by Application tab to display details about the applications that use the most bandwidth on the network. |
Top Destination Country | This displays the top three countries that received the most data traffic from the Zyxel Device. Scroll down to Traffic Detail and click the by Destination Country tab to display details about the countries that received the most bandwidth on the network. |
Top Destination Port | This displays the top three destination ports by bandwidth usage over a This displays the network applications with the greatest bandwidth usage. Scroll down to Traffic Detail and click the by Destination Port tab to display details about the ports that received the most bandwidth on the network. |
Traffic Detail | This displays the information of the traffic passing through the Zyxel Device, categorized by hostname, MAC address, user, application, destination country, and destination port. |
Device
Device data visualizations are categorized as:
CPU/Memory/Session
The following figure shows the Analysis > Device > CPU / Memory / Session data visualizations.
Analysis > Device > CPU / Memory / Session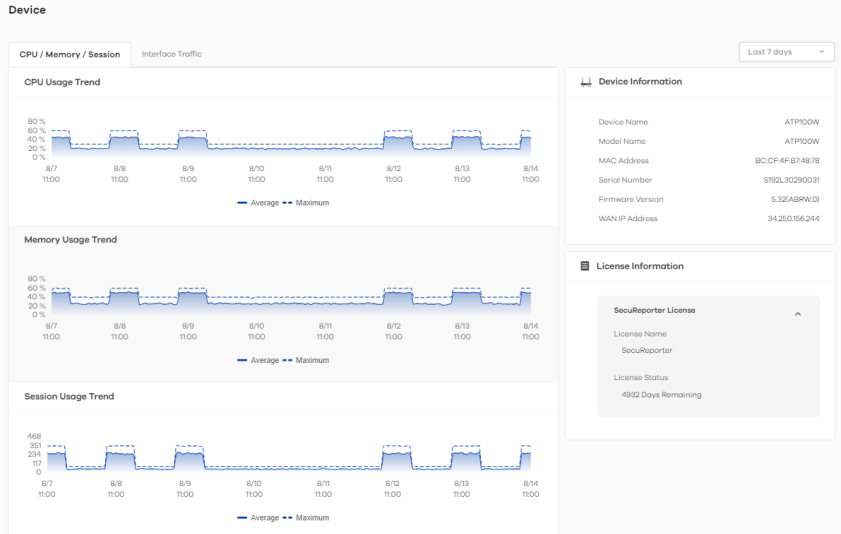
The following table describes the labels on the Analysis > Device > CPU / Memory / Session screen.
Label | DESCRIPTION |
|---|---|
CPU Usage Trend | This field displays the current CPU utilization percentage used on the Zyxel Device. |
Memory Usage Trend | This field displays the percentage of current DRAM memory utilization used on the Zyxel Device. |
Session Usage Trend | This field displays the number of concurrent NAT/security policies traffic sessions the Zyxel Device is using. |
AI Analysis | Click this to see the anomaly events detected by the system. |
Device Information | |
Device Name | This field displays the device name of the Zyxel Device. |
Model Name | This field displays the model name of the Zyxel Device. |
MAC Address | This field displays the MAC address of the Zyxel Device. |
Serial Number | This field displays the serial number of the Zyxel Device. |
Firmware Version | This field displays the firmware version of the Zyxel Device. |
WAN IP Address | This field displays the IP address of the Zyxel Device on the network. |
License Information | |
License Name | This field displays the name of the license that is linked to the Zyxel Device. |
License Status | This field displays the remaining valid days of the service’s license. This displays Active if you are using a PAYG license. |
Device Health Anomaly Detection
Device Health Anomaly Detection helps administrators identify unusual CPU, memory, and session usage. SecuReporter uses previous week’s behavior and reports on differences in the current week. If it detects a drastic change, it flags the event as an anomaly.
At the time of writing, SecuReporter collects CPU, memory, and session logs and analyzes them regularly. After gathering at least 3 days of data within a week, consecutive or not, it will build an AI baseline.
When SecuReporter finds an anomaly, it generates a summary. The summary highlights usage trends, timelines, durations, and key event details. Administrators can review these highlights and quickly trace logs to identify root causes.
At the time of writing, Device Health Anomaly Detection is available only for the following models:
USG FLEX 500H |
USG FLEX 700H |
The following figure shows the Analysis > Device > CPU / Memory / Session > AI Analysis data visualizations.
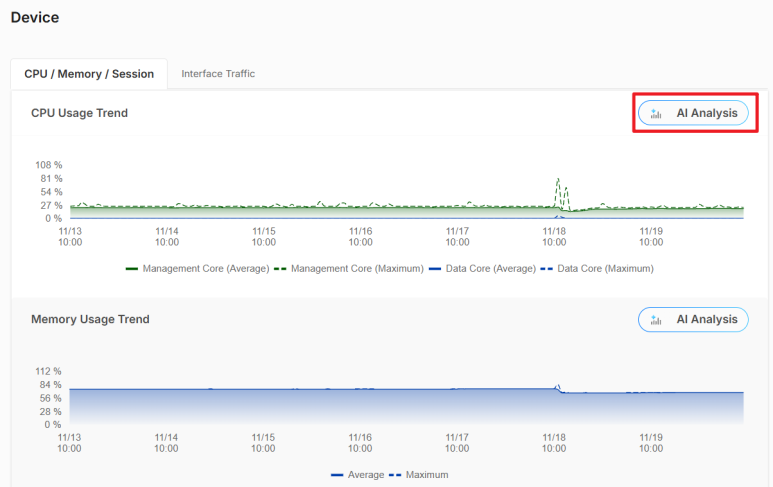
Analysis > Device > CPU / Memory / Session > AI Analysis
The following table describes the labels on the Analysis > Device > CPU / Memory / Session > AI Analysis screen.
Label | DESCRIPTION |
|---|---|
Management CPU | Click this to view the management-related CPU usage and anomalies. |
Data CPU | Click this to view the data-related CPU usage and anomalies. |
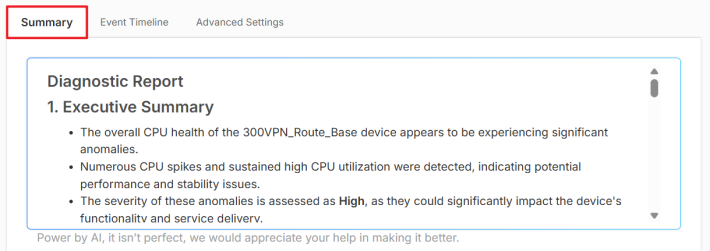
Summary | This displays an overview of the anomaly, possible causes and recommended actions. |
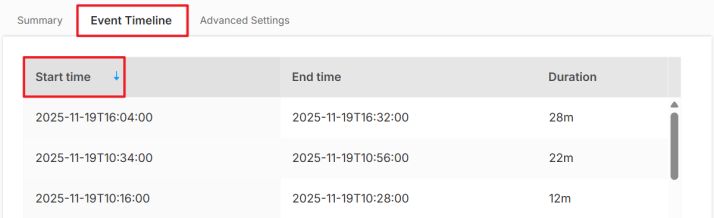
Event Timeline | This displays the start time, end time and the duration of the anomalies. |
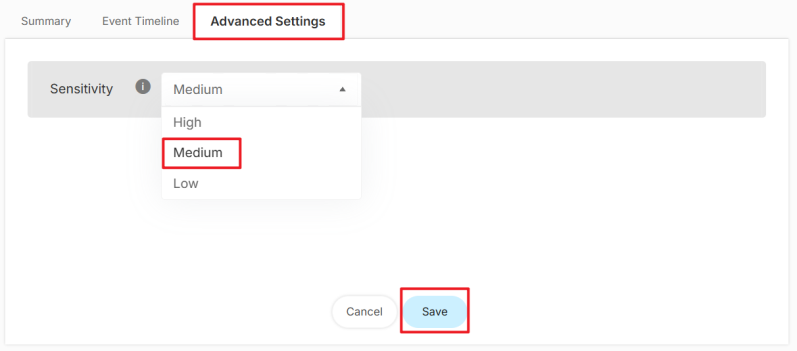
Advanced Settings | |
Sensitivity | Select the sensitivity level (Low, Medium, or High) from the drop-down menu. Higher sensitivity detects smaller deviations. See Sensitivity Level Example for the duration threshold for each level at the time of writing. |
How to View the Anomalies
1 To view the anomalies, make sure your device is powered on and online. Go to Analysis > Device > CPU / Memory / Session, and click AI Analysis.
There are three types of messages you may see:
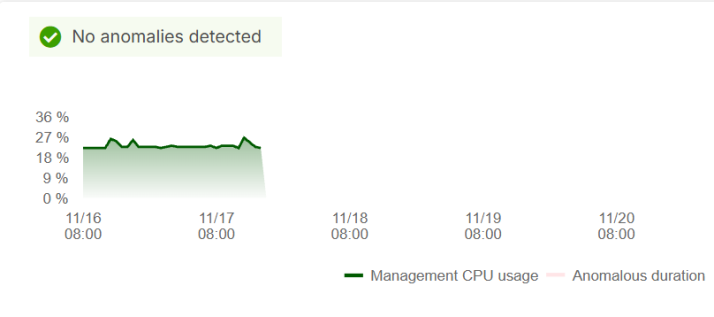
No anomalies detected
If SecuReporter does not detect any anomalies this week, the banner will display ‘No anomalies detected’. Both the Summary and Event Timeline tabs will display no data.
 No anomalies detected
Anomaly events
If anomalies are found, the banner will display the number of the anomalies detected this week. The anomalies are shown in pink. See Click the Summary tab to get an overview of the anomalies. for more details about the anomalies.
Anomaly events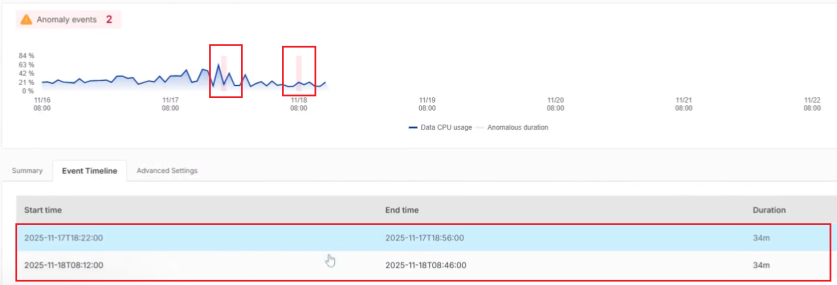
In this example, the first anomaly of the week occurred on 11/17 from 18:22 to 18:56, lasting 34 minutes. The second anomaly occurred on 11/18 from 08:12 to 08:46, also lasting 34 minutes. You can hover over the chart to view the hourly usage.
Insufficient baseline data
SecuReporter requires at least 3 days of data within a week, consecutive or not, to build a baseline. Otherwise, the banner will display ‘Insufficient baseline data’, and show you when the analysis will be available.
Insufficient baseline data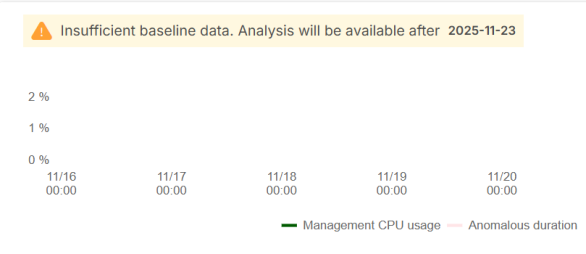
2 Click the Summary tab to get an overview of the anomalies.
3 Use the Event Timeline tab to see the start/end time and duration of each anomaly. Click each column header to sort the data according to their occurrence or duration time.
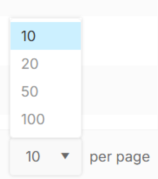
4 To adjust the detection sensitivity, click Advanced Settings and select a sensitivity level from Low to High from the drop-down menu. Then, click Save. For details on each level, see Sensitivity Level Example.
Level | DESCRIPTION |
|---|---|
High | Detects anomaly that lasts more than 10 minutes. |
Medium | Detects anomaly that lasts more than 30 minutes. |
Low | Detects anomaly that lasts more than 40 minutes. |
Interface Traffic
The following figure shows the Analysis > Device > Interface Traffic data visualizations.
Analysis > Device > Interface Traffic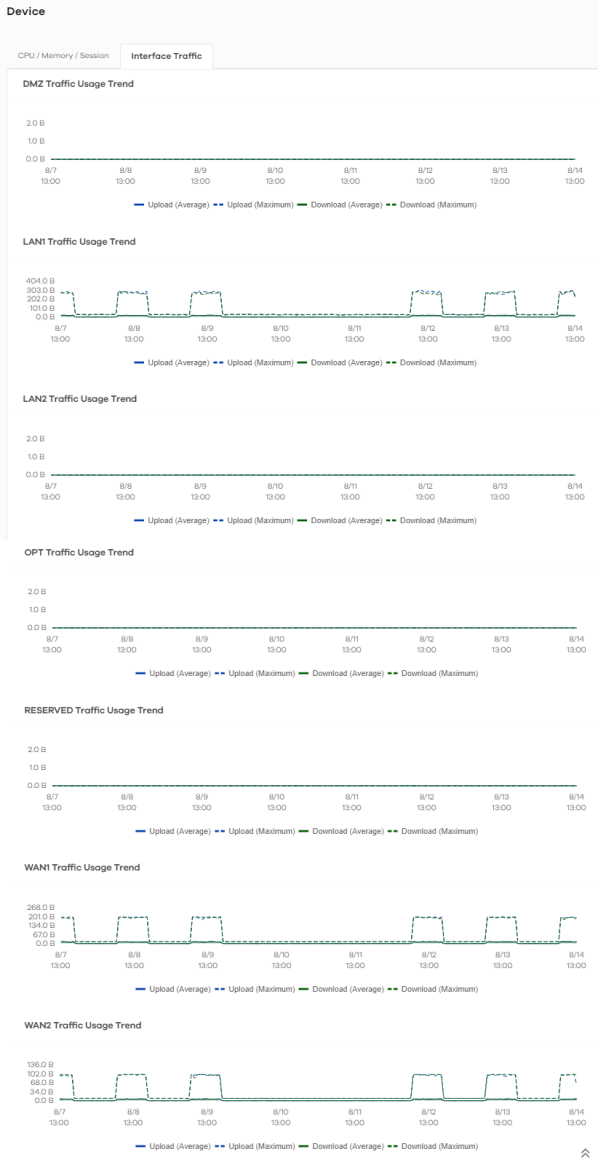
The following table describes the labels on the Analysis > Device > Interface Traffic screen.
Label | DESCRIPTION |
|---|---|
DMZ Traffic Usage Trend | This chart displays the amount of data that is transmitted on the DMZ interface over time. |
LAN1 Traffic Usage Trend | This chart displays the amount of data that is transmitted on the LAN1 interface over time. |
LAN2 Traffic Usage Trend | This chart displays the amount of data that is transmitted on the LAN2 interface over time. |
OPT Traffic Usage Trend | This chart displays the amount of data that is transmitted on the OPT interface over time. |
RESERVED Traffic Usage Trend | This chart displays the amount of data that is transmitted on the RESERVED interface over time. |
WAN1 Traffic Usage Trend | This chart displays the amount of data that is transmitted on the WAN1 interface over time. |
WAN2 Traffic Usage Trend | This chart displays the amount of data that is transmitted on the WAN2 interface over time. |